
A Shooting Coach Speaks
- ELMS Sports Foundation
- Apr 17, 2023
- 3 min read
Practical demonstration of how to use SCATT to improve athlete performance
Performance analysis tools generate data that give athletes and coaches the ability to replay precise moments and observe performance strengths, weaknesses, and areas for improvement. In this article, Dhirender Singh Jamwal rifle coach and an alumnus of the inaugural edition of the High-Performance Coach Development program demonstrates how coaches can use SCATT Shooting Trainers’ shooting analyzer tool to evaluate and improve performance. He uses real-time data to display how data can be analyzed to develop concrete insights that improve performance goals.

How to use SCATT
Shooting as a sport is continuously evolving. To stay at par, top shooters frequently upgrade parts of their equipment. While there are many training tools used by shooters and coaches, there are hardly any top athletes who have not used the SCATT Shooting Trainers’ shooting analyzer SCATT.
SCATT is an advanced electronic optical sensor that shows the path of the rifle/pistol on the target. Though SCATT is widely used in the field, based on my interactions with athletes and coaches, I feel there are few that use SCATT to its potential.
Below is all the information we can collect using SCATT.
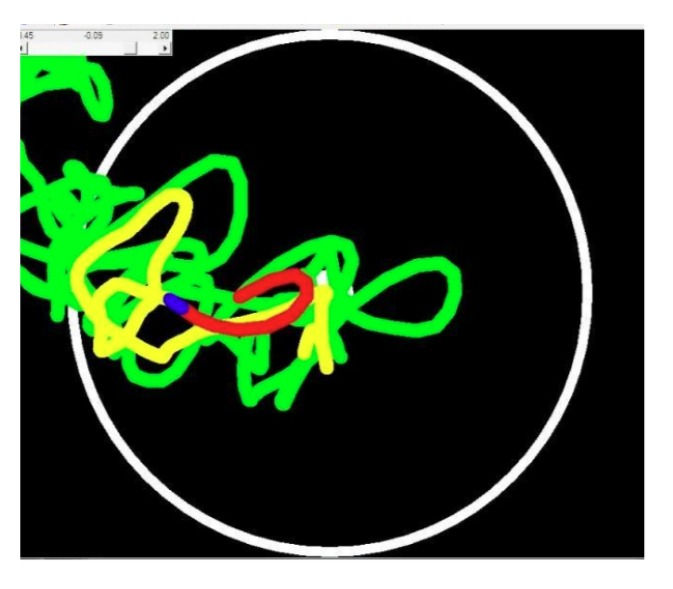
TRACE: By default, the trace is divided into 4 colors.
Green: This trace is generally the longest and shows the general aiming process.
Yellow: This trace defines the movement of your rifle 1 second before the shot. This is the time shooters usually start the triggering process.
Blue: This trace defines the movement 0.2 seconds before the shot – it normally shows the movement during the triggering.
Red: This trace defines the movement 1 second after the shot – usually the follow-through.
Everyone has different approaches to the center and these lines confirm if the path desired is being achieved and if not, where’s the room for improvement.
SCATT Trace Data Visual Examples

In the image alongside, the shooter’s ideal path would be to start at 12 o’clock. His start point is correct. However, while coming down, the shooter is moving to the left and approaching the center from the left. This indicates that the shooter is tensing some parts of the body just before reaching the center. The coach notices this and tries to locate the origin of the problem and goes on to find a solution to that.

In the visual on the left, the shooter has started triggering when
they’re in the center.
However, the shooter moves to the left as soon as they start applying the pressure and forcing the trace back to the center.

Therefore, they manage to break the shot at the center.

Considering the rifle is back in the centre, it is considered a good follow through and the position is in balance after the shot.
In this example, there are few things that demonstrate good technique. The shooter can go deeper into understanding their technique in these aspects. Where there is room for improvement, the corrections can be made immediately.
SCATT Data Table
SCATT’s data tables present us with multiple data points to understand performance.
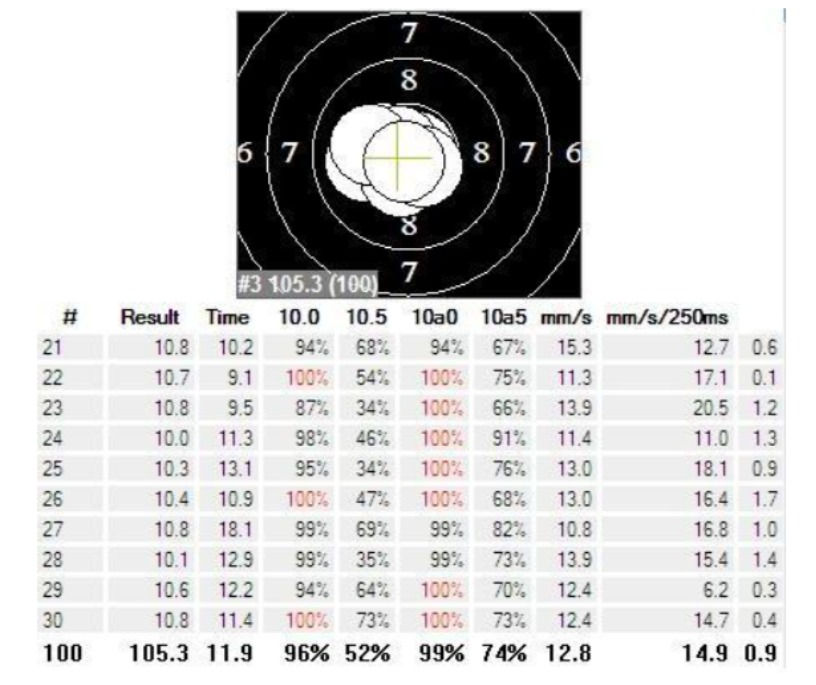
TIME: This is the time recorded from the time the trace touches any part of the target to the time the trace leaves the target.
10.0 – Percentage of time that the trace is in the 10.0 area, 1 second before the shot.10.5 – Percentage of time that the trace is in the 10.5 area, 1 second before the shot.
10a0 – Percentage of time that the hold is in the 10.0 area, 1 second before the shot. The difference between 10a0 and 10.0 is that 10.0 is aligned to the center, whereas 10a0 is not aligned to the center. This defines the capability of the shooter to shoot a 10.0 if the aim was in the center.
10a5 – Percentage of time that the hold is in the 10.5 area 1 second before the shot. The difference between 10a5 and 10.5 is that 10.5 is aligned to the center, but 10a5 is not aligned to the center. This defines the capability of the shooter to shoot a 10.5 if the aim was in the center.
mm/s – This defines the average speed of the trace in the last second.
mm/250ms – This is the average speed of the trace in the last 250 milliseconds. If this value is higher than the mm/s, it means the shooter is jerking while triggering.
[Blank heading] – This is the average aim point in the last second. This is the length of the start of the yellow line and the end of the blue line.


Comments